
Figure 2.
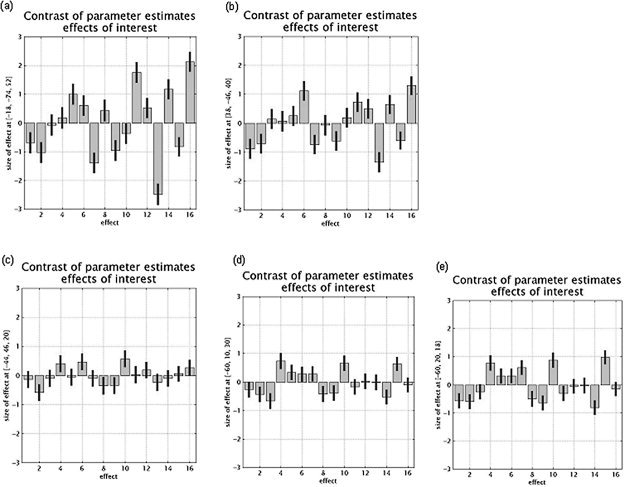
Plots of relative cerebral activity for the regions highlighted in the conjunction analysis of the three executive processes. a: Left superior parietal cortex (BA 7). b: Right intraparietal sulcus. c: Left middle frontal gyrus (BA 46). d: Left middle frontal gyrus (BA 10). e: Left inferior frontal gyrus (BA 45). The coordinates of each voxel are indicated on the y‐axis (Montreal Neurological Institute [MNI] coordinates). Cognitive tasks are represented on the x‐axis (1–3, updating control tasks; 4–6, updating experimental tasks; 7–9, shifting control tasks; 10–12, shifting experimental tasks; 13–14, inhibition control tasks; 15–16, inhibition experimental tasks).