
Figure 3.
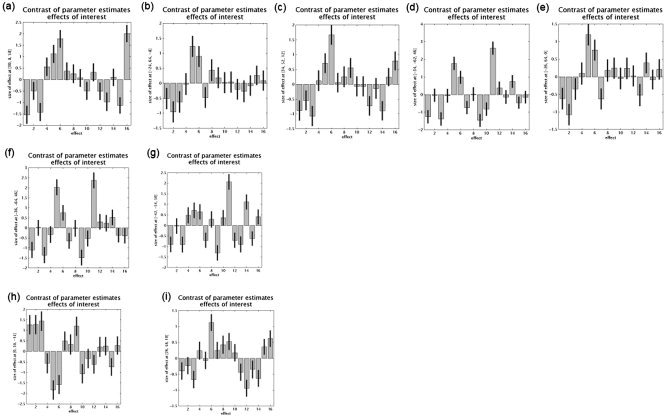
Plots of relative cerebral activity in the 16 cognitive tasks. First line: cerebral areas more active in the updating process compared to that in shifting (a–c) and inhibition (d, e) processes. Second line: cerebral areas more active in the shifting process compared to that in the inhibition (f, g) process. Third line: cerebral areas more active in the inhibition process compared to that in the updating (h) and shifting (i) processes. The coordinates of each voxel are indicated on the y‐axis (MNI coordinates); cognitive tasks are represented on the x‐axis (1–3, updating control tasks; 4–6, updating experimental tasks; 7–9, shifting control tasks; 10–12, shifting experimental tasks; 13–14, inhibition control tasks; 15–16, inhibition experimental tasks).