
Figure 2.
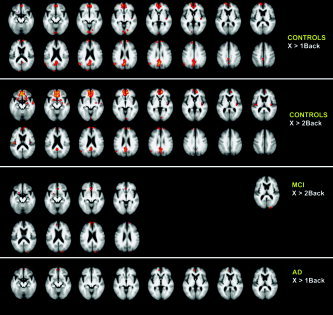
Transverse sections with Z‐statistics of average deactivation in controls, MCI, and AD in the working memory task (P < 0.05, corrected). The underlying structural image is the average image of all controls and patients; left in image is left in the brain. MCI patients only show significant deactivation in the increased WM load condition (2BACK). AD patients only show deactivation in the 1BACK condition. Z‐scores are color‐coded from 3.1 (red) to 8.5 (yellow) for 1BACK, and from 3.1 to 9.9 for 2BACK.