
Figure 3.
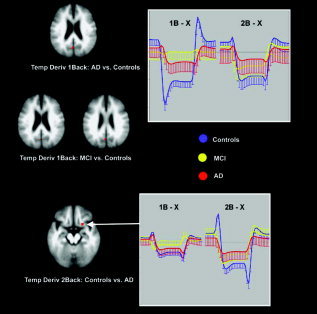
Differences in deactivation during the working‐memory task between patients and controls. The graphs show the estimated responses with standard deviations. Differences in this task are only significant for the very early phase of the deactivation response represented by the parameter estimate of the temporal derivative. 1B = simple working memory; 2B = increased working memory load.