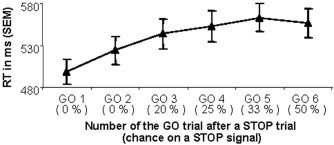
Figure 3.

Effect of increasing STOP likelihood on GO reaction time (RT; in ms ± SEM). Between two consecutive STOP trials, at least two but no more than six GO trials could be presented. The chance of a STOP signal occurring in a specific GO trial (in brackets) therefore increases as more GO trials follow a STOP trial.
