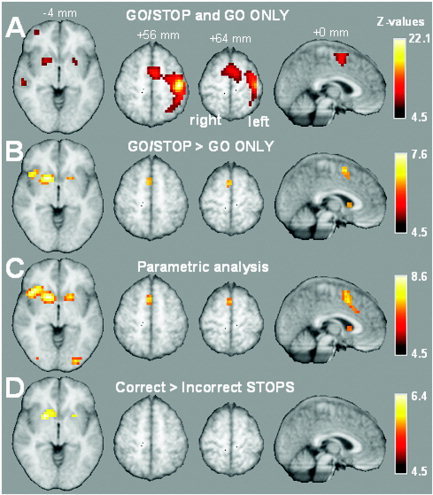
Figure 4.

Overview of brain activation overlaid on selected slices of the mean anatomic group image thresholded at P < 0.05 corrected for multiple comparisons (i.e., z = 4.5). A: Combined brain activation during all GO trials from both GO ONLY and GO/STOP. B: Contrast in brain activation between GO trials from GO ONLY and GO/STOP task (GO trials from GO/STOP > GO ONLY). C: Brain activation correlated with the amount of control required on GO trials. D: Contrast in brain activation between correct and incorrect STOP trials (correct STOP > incorrect STOP).
