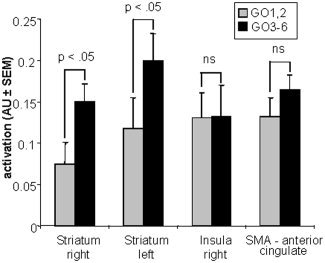
Figure 5.

Mean activation level in the regions of interest selected from the GO from GO/STOP vs. GO ONLY contrast (Fig. 4B), being left and right striatum, right insula and the anterior cingulate (±SEM) during the first two GO trials after a STOP trial (GO1,2; 240 events, gray bars) and third until the sixth GO trial after a stop (GO3–6; 240 events, black bars).
