
Figure 3.
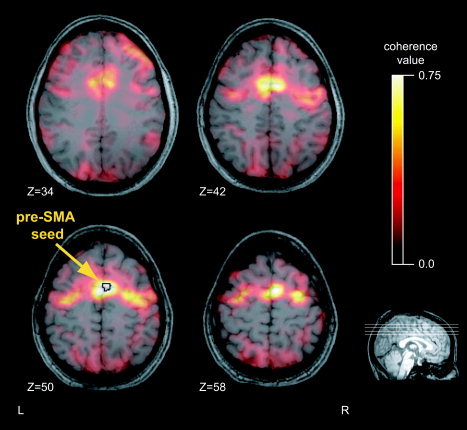
Coherence maps exhibit specific peaks. A typical condition‐specific coherence map is shown for a single subject's pre‐SMA seed during antisaccades. Lighter colors indicate greater coherence. Location of the seed region is indicated with an arrow and a black outline. Z indicates the vertical coordinates of the anatomical slices (MNI).