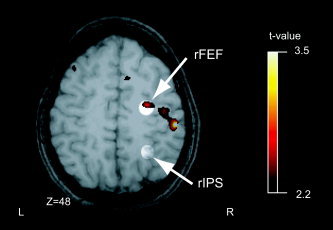
Figure 4.

Coherence contrast maps with the pre‐SMA seed. The antisaccade‐prosaccade group difference map for the coherence analysis is shown. The regions defined by the rFEF and rIPS ROIs are highlighted. Within the rFEF ROI, the significant voxels indicate increased coherence between the rFEF and the pre‐SMA during the antisaccade task as compared to the prosaccade task. No significant voxels were detected in the ROI for the rIPS. Z indicates the vertical coordinates of the anatomical slice (MNI).
