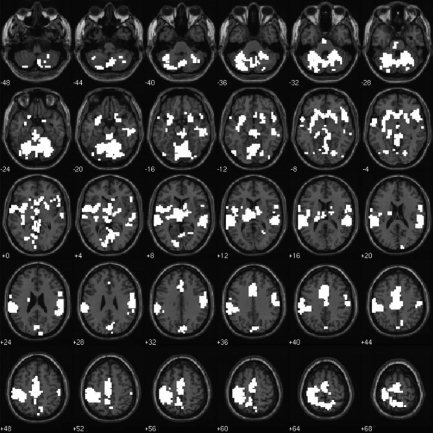
Figure 4.

Illustration of the five significant clusters of activation in which Go events elicited a greater hemodynamic response than did NoGo events in the visual sensory modality. Data are presented in the format used in Figure 1. The image is thresholded at a height of t(9) = 2.82, corresponding to a significance level of P ≤ 0.01 uncorrected for multiple comparisons conducted throughout the whole brain. Clusters are significant at P ≤ 0.05 corrected for multiple comparisons.
