Abstract
Integrating electroencephalography (EEG) and functional magnetic resonance imaging (fMRI) data may help to optimize anatomical and temporal resolution in the investigation of cortical function. Successful removal of fMRI scanning artifacts from continuous EEG in simultaneous recordings has been reported. We assessed the feasibility of recording reliable visual evoked potentials (VEPs) during fMRI scanning using available artifact removing procedures. EEG during administration of visual stimuli was recorded using MRI‐compatible 32‐channel equipment in nine normal subjects (mean age, 23.9 ± 2.5 years), with and without fMRI acquisition. fMRI scanning and cardioballistographic artifacts were removed after subtraction of averaged artifact waveforms. Consistency between VEPs waveforms and of P1 and N1 peak latencies and amplitudes in the two conditions was assessed. Good correlation was found between VEP waveforms (Pearson's correlation coefficient: r P between 0.76–0.94 across subjects; P < 0.0001) and between latency or amplitude of P1 and N1 peaks (latencies: r = 0.7, P < 0.035; amplitudes: r > 0.65, P < 0.05; Spearman rank correlation coefficient) in the two recording conditions. No significant differences were found between P1 and N1 parameters in the two conditions (Wilcoxon signed rank test). Consistent VEP waveforms, latencies, and amplitudes with and without fMRI scanning indicate that reliable VEPs may be obtained simultaneously with fMRI recording. This possibility might be helpful by shortening recording times and reducing variability from learning, habituation, and fatigue phenomena from separate recordings for the integration of event‐related EEG and fMRI data. Hum. Brain Mapping 24:291–298, 2005. © 2005 Wiley‐Liss, Inc.
Keywords: evoked potentials, EEG‐fMRI simultaneous recording, artifact removing, electroencephalography, functional MRI
INTRODUCTION
In the investigation of cortical function, there is great interest in integration of information provided by electroencephalography (EEG) and functional magnetic resonance imaging (fMRI) to take advantage of the high temporal resolution provided by EEG and the high spatial resolution of fMRI [Bonmassar et al., 2002].
In many situations, reduced time spent in recording and the implementation of protocols to limit learning, habituation, and environmental sources of variability would be of great interest. Simultaneous EEG/fMRI is particularly valuable for reducing possible discrepancies due to different environmental and cognitive states in the two examinations. Moreover, single‐session recordings are necessary when evaluating fMRI correlates of EEG pathologic activities (e.g., epileptic spikes).
Single‐session recording of EEG and fMRI leads to some problems related to the quality of both signals. As demonstrated previously [Bonmassar et al., 2001a; Krakow et al., 2000], appropriate shielding of the EEG equipment can eliminate noise from fMRI images, allowing the recording of an uncorrupted blood oxygenation level‐dependent (BOLD) signal. However, static and time‐varying magnetic fields of MRI greatly affect EEG, according to the Faraday Induction Law. There are three main causes of interference [Allen et al., 1998, 2000; Goldman et al., 2000; Salek‐Haddadi et al., 2003a, b]: (1) gross head movements in the static magnetic field; (2) blood pulse and small head movements due to cardioballistographic effect in both static and time‐varying magnetic field; and (3) radio frequency (RF) impulses and gradients during MRI scanning (time‐varying magnetic field).
The first type of artifact may be limited by constraining the subject's head [Benar et al., 2003], whereas for the latter two it would be necessary to develop one or more postprocessing artifact‐removal procedures.
To date, two main approaches have been developed [Salek‐Haddadi et al., 2003a]: (1) interleaved EEG/fMRI recordings using aperiodic (i.e., spike‐triggered fMRI) or periodic fMRI; and (2) simultaneous EEG and fMRI acquisition.
Aperiodic EEG‐triggered fMRI recording has been described as [Krakow et al., 1999, 2001; Shomer et al., 2000] applied in presurgical assessment of epilepsy for identification of epileptic focus [Seeck et al., 2001; Zimine et al., 2003]. A procedure for cardioballistographic effect removal could be necessary to diminish the number of false positive spikes [Allen et al., 1998].
In periodic interleaved EEG/fMRI recordings, time windows of EEG free of gradient artifacts are obtained by designing proper fMRI sequences [Bonmassar et al., 2001b; Goldmann et al., 2000]. Postprocessing for removal of cardiac pulse artifacts [Allen et al., 1998; Bonmassar et al., 2002; Goldmann et al., 2000] can be useful to improve EEG readability. Somatosensory [Christmann et al., 2002], visual [Foucher et al., 2003; Kruggel et al., 2000, 2001], and auditory [Liebenthal et al., 2003] evoked potentials (EPs) and sleep [Lovblad et al., 1999] have been studied using this technique, with block design stimulation paradigms. An application to the localization of somatosensory areas was made using simultaneous interleaved EEG‐fMRI recording in an event‐related fMRI protocol [Thees et al., 2003].
Continuous and simultaneous EEG and fMRI acquisition with standard fMRI sequences would require removing fMRI scanning artifacts from the EEG. A proposed approach [Allen et al., 2000] applies to each channel the subtraction of modeled artifact waveforms, followed by a procedure of adaptative noise cancellation. The efficacy of this method has been evaluated in identification of EEG events (i.e., epileptic spikes), using an event‐related fMRI approach [Lemieux et al., 2001], and in the investigation of the correlation between alpha EEG oscillations and BOLD changes [Laufs et al., 2003; Moosmann et al., 2003]. Another method [Hoffmann et al., 2000] analyzes the scanning artifact frequencies and removes the artifact by implementing a Fourier filter. Recent studies [Al‐Asmi et al., 2003; Benar et al., 2003] applied this approach to find metabolic sources of epileptic spikes. To our knowledge, application of procedures for simultaneous and continuous EEG/fMRI acquisition and artifact removal has not been reported in the recording of evoked potentials, whose amplitude is several times smaller than that of epileptic spikes or alpha oscillations. We investigated the feasibility of obtaining reliable visual evoked potentials (VEPs) during simultaneous, continuous EEG and fMRI acquisition with standard fMRI sequences, using an available artifact‐correction method [Allen et al., 2000].
SUBJECTS AND METHODS
EEG/fMRI Recording
Nine right‐handed, normal subjects (three women, six men; mean age, 23.9 ± 2.5 years) carried out a simple visual reaction time task. All subjects gave their informed consent to participate in the study, which was approved by the local ethical committee. Visual stimuli, administered using MRI‐compatible goggles (Visuastim XGA, Resonance Technology, Los Angeles, CA), consisted of colored words (green, yellow, blue, and red) appearing on a black background. Subjects were instructed to press a button with their right hand after the appearance of the stimulus, and to limit their blinking to the intervals between trials. Two series of 100 stimuli (10‐ms duration) were delivered at a random interstimulus interval of 3–5 s. During the first set, EEG was recorded while the subject was in the scanner but without fMRI scanning; during the second set, EEG was recorded during fMRI scanning. Continuous EEG was recorded while the subject was in the scanner, using a MRI‐compatible 32‐channel amplifier (BrainProducts, GmbH, Germany), with AgCl electrodes mounted on an elastic cap according the standard 10/20 system with additional locations, with cephalic midline frontocentral reference. An electrooculogram (EOG) electrode was placed under the right eye; two electrocardiographic (EKG) electrodes were placed symmetrically with respect to the sternum, spaced by a 10‐cm distance. Electrode wires were sewed on the cap or taped on the patient's skin (EKG and EOG electrodes) to prevent loop formation and limit movements, which would induce artifact currents. At the top of the cap, wires were taped together and connected to the amplifier outside the magnet through a flat cable. MRI‐compatible sandbags were applied to limit movements of the cable. An optical cable was used to connect the amplifier to the PC outside the MRI scanning room to avoid any induced currents. The subject's head was fixed by taping the forehead and goggles to the scanner couch. A resolution of 0.5 μV and a 5‐kHz sampling rate were used.
The MRI scanner was a 1.5 Tesla Marconi‐Picker (Marconi Corp., Cleveland, OH). An echo planar gradient‐echo (echo time [TE] = 66.3 ms; flip angle = 60 degrees) sequence was used. Geometric characteristics were the following: field of view (FOV) = 260 mm; matrix 128 × 128; and thickness = 5 mm.
For each acquisition, 166 volumes were acquired (19 slices/volume, transverse slice orientation) with a repetition time (TR) of 2,256 ms. This scanning procedure was chosen for subsequent event‐related fMRI analysis; results from fMRI analysis are not the subject of the present study and therefore will not be considered further.
EEG Analysis
For removing fMRI scanning‐related and cardiac pulse artifacts, we followed a previously described postprocessing procedure [Allen et al., 1998, 2000] implemented in Vision‐Analyzer v1.04 software (Brain Products). The algorithm is composed of two parts: the first involves removal of the artifact due to variable magnetic field (RF pulses and gradients), whereas the second operates on the cardioballistographic effect. As a basic hypothesis, it was assumed that the artifact introduced by the scanner was the same in each MR‐scanning period (1 volume). According to the procedure described by Allen et al. [2000] for each recorded channel, a model of the fMRI scanning artifact waveform was created by averaging at least 25 waveforms corresponding to first 25 scanning volumes; this model was then subtracted from the recorded data. The high sampling rate (5 kHz) was necessary to build a good artifact wave model and to carry out more accurate subtraction and filtering processes. The signal was smoothed before downsampling to 250 Hz. A low‐pass filter (FIR filter, Hanning window, cut‐off frequency 50 Hz) was used in the range of the scanned intervals to delete residual high frequencies induced during the subtraction process. Unlike the method described by Allen et al. [2000], which triggered the scanning volume from the MRI scanner, we applied a detection algorithm directly on EEG signal to find the onset of each scanning volume, granting a good time resolution (0.2 ms) and thus limiting possible trigger delays from the scanner.
The technique for removing cardiac effects from signal requires a robust EKG peaks detection method. To identify the R‐peaks correctly, the algorithm operates under three similarity criteria: amplitude, correlation, and frequency of the artifact event [Allen et al., 1998, 2000]. A waveform was identified as cardiac pulse artifact when all these criteria were observed. On each EEG channel, a template of the artifact was built by averaging 25 epochs (1 s) synchronous to EKG R‐peaks. This template was then subtracted from each EEG channel in correspondence to the peaks with a delay of 0.21 s (due to hemodynamic effects). The whole procedure was applied offline to the EEG recordings carried out simultaneously with fMRI acquisition. On the EEG recorded in the static magnetic field (i.e., without fMRI acquisition), identical processes of smoothing, downsampling, filtering, and then cardiac artifact correction were applied.
After application of the whole artifact‐removing procedure to both recordings, epochs of 350 ms starting 50 ms before each visual stimulus were obtained (baseline correction from 50 to 5 ms prestimulus). All segments with amplitude higher than 80 μV were rejected to exclude from further analysis sweeps containing eye movement or other behavioral artifacts; data were also inspected visually to detect other possible artifacts. Finally, remaining sweeps were averaged. Latency and amplitudes of P1 and N1 peaks were measured for each subject on O1 or O2 occipital electrodes. For each subject, the occipital electrode with the higher P1 amplitude in the recording without fMRI was selected; the same electrode was then considered for statistical analysis in recordings with and without fMRI.
To verify the need to apply artifact correction algorithms, for each recording condition (i.e., with or without fMRI scanning), we averaged epochs (to the same events selected for obtaining VEPs) obtained in the corresponding raw uncorrected signal.
Statistical Analysis
The efficacy of cardiac pulse correction was assessed in the recordings carried out in the static magnetic field only (i.e., without fMRI scanning), affected only by cardiac pulse artifact. As a “goodness of fit” index between VEP waveforms obtained from uncorrected and corrected EEG, the cross‐correlation function was calculated (from stimulus onset to 250 ms, thus excluding prestimulus noise). Comparison of signal‐to‐noise ratio (SNR) of VEPs obtained before and after cardiac pulse correction from both recordings (with and without fMRI scanning) was carried out using the Wilcoxon signed rank test.
The consistency of VEPs obtained during fMRI scanning (after application of both algorithms for removing scanning and cardiac pulse artifacts) was evaluated by measuring VEP reproducibility between the two recordings (with and without fMRI scanning). P1 and N1 latencies and amplitudes in the different conditions (i.e., with and without fMRI) were correlated using the Spearman rank correlation coefficient. Magnitude systematic differences between P1 and N1 obtained with vs. without fMRI, which would not affect the correlation between the two conditions [Deyo et al., 1991], were assessed by means of Wilcoxon signed rank test. Cross‐correlation function and Pearson's correlation coefficient (r P) were also calculated between VEPs obtained after cleaning procedures in the following cases: (1) average of odd versus even responses in recordings without fMRI scanning; (2) average of half responses (even stimuli) in recordings with versus without fMRI scanning; and (3) average of all responses from recordings with versus without fMRI scanning.
RESULTS
The raw EEG recorded in static magnetic field (no fMRI scanning; Fig. 1A) presented peaks that were synchronous and delayed with respect to heart activity (Fig. 1B). An example of EEG traces after application of the algorithm for cleaning cardioballistographic pulse artifact is shown in Figure 1C. All subjects performed well in the scanner; thus only a few epochs (from 0 to 8), mostly containing blinks, were discarded. After cardiac pulse correction, the SNR of the averaged VEPs was significantly higher compared to that of VEPs obtained without the correction procedure (mean SNR for uncorrected signal: 1.7 ± 1.0; mean SNR for corrected signal: 2.25 ± 0.9; P = 0.0078, Wilcoxon signed rank test) (Fig. 2).
Figure 1.
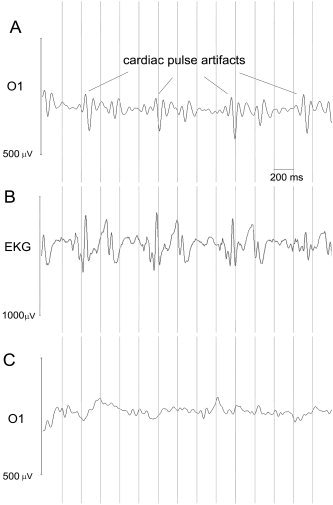
A: Raw EEG trace recorded in static magnetic field, without MRI scanning, for a representative subject (electrode O1). Peaks synchronous and delayed of a constant lag respect to cardiac activity (channel EKG) are clearly visible, indicating that they are due to cardiac pulse effect. B: Raw EKG trace recorded in static magnetic field: peaks are detected and marked. C: Reliable EEG obtained after correction procedure for electrode O1.
Figure 2.
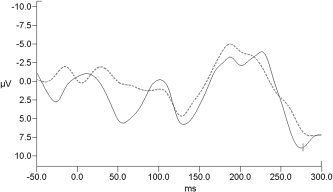
VEPs computation for one representative subject (electrode O1) from recording in static magnetic field (no fMRI scanning condition). The solid line represents the VEPs obtained without cardiac pulse artifact postprocessing correction; the dotted line represents the same signal obtained after cardiac pulse artifact removal. P1 and N1 peaks can be recognized in both cases, but uncorrected signal shows a higher noise.
A strong correlation was found for each subject between VEPs waveforms obtained in the static magnetic field before and after cardiac pulse correction; the cross‐correlation function between these two recordings presented a maximum in proximity of 0 shift (no significant shift from 0 ms; mean shift, 0.2 ± 3.2; Wilcoxon test not significant). Values of the Pearson's correlation coefficient (at 0 time shift) ranged from 0.84 to 0.99 (P < 0.0001). P1‐N1 complex was detected in all subjects. Table I shows group mean values of latencies and amplitudes of P1 and N1 peaks of VEPs waveforms obtained after application of the cardiac pulse artifact‐cleaning algorithm to recordings in static magnetic field.
Table I.
P1 and N1 latencies and amplitudes detected in recording with or without fMRI scanning after postprocessing procedures
| Parameter | Without fMRI | With fMRI scanning | ||
|---|---|---|---|---|
| P1 | N1 | P1 | N1 | |
| Latency | 110 ± 17.8 | 177 ± 18.3 | 109 ± 12.3 | 182 ± 17.1 |
| Amplitude | 7 ± 2.7 | −7.7 ± 5.6 | 6 ± 3 | −6.6 ± 5.2 |
Values are expressed as mean ± SD.
The raw EEG recorded during fMRI scanning (Fig. 3A) was clearly corrupted by magnetic field interference. The morphology of the artifact observed in signals recorded simultaneously with fMRI scanning was different in each channel; this resulted in higher overall amplitudes (which in some channels could reach 1 mV peak‐to‐peak) and in the presence of nonphysiologic peaks. When no scan artifact removal procedure was applied, stimulus‐synchronized averaging did not produce recognizable VEPs (Fig. 4). Waveforms obtained using this method were therefore not considered further. At the end of the scanning artifact correction procedure on the EEG recorded during fMRI scanning, the signal decreased in amplitude and the peaks related to cardiac pulse (Fig. 3B) became evident. Results after cardiac pulse artifact correction are shown in Figure 3C. Similarly to VEPs from recordings in the static magnetic field, mean SNR increased after application of the cardiac pulse artifact correction algorithm (no pulse correction: mean SNR 1.7 ± 1; after correction: SNR 2.2 ± 0.9; P = 0.02, Wilcoxon signed rank test). Again, P1‐N1 complex was detected in all subjects; Figure 5 depicts the scalp VEP topographic distribution of the group grand averages obtained in both recording modalities. Mean latencies and amplitudes for P1 and N1 peaks are reported in Table I. Significant correlation was present between both latencies and amplitudes of P1 and N1 obtained with and without fMRI scanning (P1 latency: r = 0.7, P = 0.035; P1 amplitude: r = 0.65, P = 0.05; Spearman rank correlation; N1 latency: r = 0.7, P = 0.028; N1 amplitude: r = 0.8, P = 0.009; Spearman rank correlation). No significant difference was found between VEPs latencies and amplitudes with versus without fMRI (Wilcoxon signed rank test).
Figure 3.
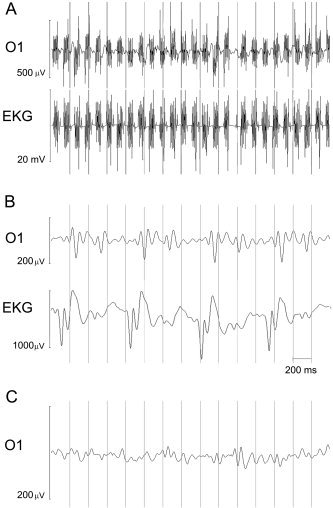
A: Raw EEG traces recorded during MRI scanning for a representative subject (electrode O1 and cardiac channel EKG). During fMRI acquisition, the EEG is clearly corrupted by artifact induced by magnetic interference. B: O1 and EKG traces after application of procedure for scanning artifact removal. Peaks due to cardiac activity are visible. C: Trace at the end of the whole correction procedure.
Figure 4.
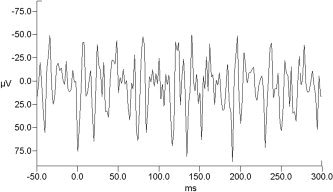
Stimulus‐synchronized averages (100 stimuli) from recording during fMRI scanning with no artifact‐removal procedure for a representative subject (electrode O1). No VEPs waveforms could be recognized.
Figure 5.
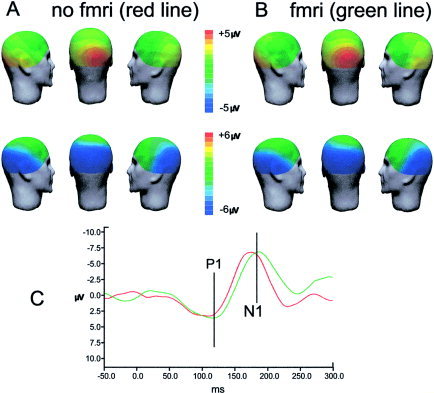
Topographic maps of VEPs amplitude obtained after artifact‐removing procedures for the grand averages of all subjects. A: VEPs obtained in the recordings without fMRI scanning (after removal of cardiac pulse artifact only). B: VEPs obtained in the recordings during fMRI scanning (after removal of both fMRI scanning and cardiac pulse artifacts). C: VEPs waveforms at electrode O2 (red line, no fMRI condition; green line, fMRI condition). The occipital P1 and N1 peaks may be identified at similar latencies in both recording conditions.
The reproducibility of VEPs was studied for each subject using cross‐correlation function and Pearson's correlation coefficient. Concerning the within session reproducibility (even vs. odd trials) in the no scanning condition, the maximum peak of the cross‐correlation function was not shifted significantly from 0 ms (mean −0.46 ± 6.2; Wilcoxon signed rank not significant) with r P ranging from 0.58 to 0.95 (P < 0.0001; Table II). Concerning the between session reproducibility, the main peak of cross correlation function between the two recording conditions (no scanning vs. scanning) was not shifted significantly from 0 ms both using the whole set of trials (mean 2.4 ± 5.1; Wilcoxon test not significant) and the even responses (mean 0.05 ± 12.1; Wilcoxon test not significant); r P ranged from 0.76 to 0.94, (P < 0.0001) and from 0.54 to 0.96 (P < 0.0001) for the even responses (Table II). Figure 6 shows the between‐session cross‐correlation function calculated for each subject using all responses. Pearson's correlation coefficients obtained in the within and between session analyses using half of the responses did not significantly differ (Wilcoxon signed rank test).
Table II.
Pearson's correlation coefficients computed for visual evoked potentials within recordings without scanning (half responses) and in between sessions (half or all responses) after cleaning procedure
| Subject | No scanning, odd vs. even responses | Even responses, no scanning vs. scanning | All responses, no scanning vs. scanning |
|---|---|---|---|
| A | 0.87 | 0.88 | 0.89 |
| B | 0.87 | 0.96 | 0.93 |
| C | 0.82 | 0.72 | 0.89 |
| D | 0.71 | 0.54 | 0.84 |
| E | 0.88 | 0.87 | 0.94 |
| F | 0.77 | 0.77 | 0.76 |
| G | 0.91 | 0.81 | 0.94 |
| H | 0.58 | 0.79 | 0.77 |
| I | 0.95 | 0.91 | 0.94 |
P < 0.0001 for all subjects.
Figure 6.
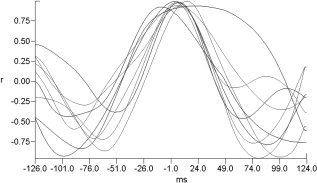
Cross‐correlation functions. For each subject, the selected occipital electrode is shown. In correspondence to 0‐ms time shift, a high value of correlation function was found, thus indicating a good similarity between the two VEPs waveforms.
DISCUSSION
Positron emission tomography (PET) and more recently fMRI [Hennig et al., 2003; Kessler, 2003] have provided a bulk of information on brain function in normal and pathologic conditions. The integration of continuous EEG recording and fMRI information could lead to benefit from the high EEG temporal resolution and the high fMRI spatial resolution. This complementarity becomes of great importance in the development of brain functional localization techniques [Bonmassar et al., 2002; Christmann et al., 2002; Lemieux et al., 2001]. There are several reasons to prefer a simultaneous rather than sequential recording of EEG and fMRI. A potential source of variability may be represented by errors in the anatomic matching of the scalp EEG electrodes [Wagner and Fuchs, 2001]. Moreover, cognitive performance may be influenced by the experimental setting and environmental conditions, which may require different adaptation by the subject. Separate recordings may be more susceptible to variability due to differences in the subject's state, such as vigilance and attention. Finally, repeating a task may involve learning and adaptation processes. All these factors may contribute to increase variability between the information gathered in separate recordings.
The present findings suggest that the technique used for removing artifacts from EEG recorded in the MRI environment, without or during fMRI scanning, is a valid procedure and can be applied to the analysis of visual evoked potentials in different subjects.
We first adopted some precautions in the scanner room to fix electrical cables, goggles and patients' forehead on the scanner couch, obtaining a setting that allowed us to limit interference related to subjects' movement according to that suggested previously [Benar et al., 2003].
We next proved the necessity of applying a postprocessing procedure to the signal even for the case of EPs, which are obtained through averaging, thus involving partial phase cancellation of signals that were nonsynchronous with the stimuli. In our recordings, in case of simultaneous EEG and fMRI acquisition, the signal obtained through averaging did not show identifiable VEPs waveforms, being still corrupted by the scanning artifact. After scanning artifact corrections, the same number of stimuli delivered in our protocol was sufficient to obtain a recognizable VEP. Moreover, VEPs were consistent across the two recording conditions (with and without fMRI scanning): comparison of mean VEPs amplitudes and latencies, together with the high correlation between VEPs waveforms in correspondence of 0 time shift, indicated that no systematic bias was introduced in our data by the scanning artifact removing procedure. It is therefore possible to suggest that, in our data, fMRI scanning did not significantly influence the quality of the VEPs obtained after the scanning artifact‐removing procedure.
The cardiac pulse artifact‐removal algorithm also proved useful to obtain reliable VEPs. Even though a VEP waveform could be identified without application of cardiac pulse artifact removing procedure, the SNR increased after application of the correction, indicating that the algorithm allowed obtaining signals less affected by noise. Moreover, the high cross‐correlation values between corrected and uncorrected waveforms showed that no distortions had been introduced by the cardiac pulse‐removing procedure.
The similar, high correlation values within and between sessions indicate that we could reach a great replicability of measures and that there was no significant difference between VEPs obtained in continuous, simultaneous EEG/fMRI recordings (after application of the postprocessing procedure) and those obtained in recordings without fMRI scanning.
It is also important to take into consideration the upper limit of number of stimuli and trials, linked to the duration of experiment in the scanner [Kruggel et al., 2000]. In fact, in event‐related EEG analysis, the possibility to read the EEG trace only in periods free of scanning artifacts (such as in case of interleaved EEG/fMRI recording) would require supplementary number of stimuli to be delivered with lengthening of the recording session or to develop “asymmetric” stimulation protocols in which the largest part of stimuli are presented in no‐gradient periods [Foucher et al., 2003]. In our study, the application of an algorithm for cleaning scanning artifacts in continuous and simultaneous EEG/fMRI recordings allowed us to obtain reliable signals with a relatively low number of repetitions, without requiring to adapt fMRI scanning sequences to obtain the desired periods of artifact‐free EEG.
CONCLUSIONS
Our findings showed that it is possible to obtain reliable VEPs in the MRI scanner, even during fMRI acquisition. The scanning artifacts were removed satisfactorily without changing the information, with the possibility to extract evoked potentials, with magnitude several times lower than continuous EEG, for event‐related studies. The possibility of obtaining reliable EPs during simultaneous EEG/fMRI recording would ease and widen the possibilities of investigating event‐related brain activity to cognitive or motor tasks, helping to reduce recording times and potential environmental and individual sources of variability, as compared to separate recordings. Continuous and simultaneous EEG‐fMRI has been applied successfully to map spikes and slow waves in a patient with a left hemiparesis and focal epilepsy [Diehl et al., 2003]. The next step would be the localization of cortical areas related to functional tasks.
Acknowledgements
We thank the reviewers for their helpful comments and suggestions on the early version of this article.
REFERENCES
- Al‐Asmi A, Benar CG, Gross DW, Aghakhani Y, Andermann F, Pike B, Dubeau F, Gotman J. (2003): fMRI activation in continuous and spike‐triggered EEG‐fMRI studies of epileptic spikes. Epilepsia 44: 1328–1339. [DOI] [PubMed] [Google Scholar]
- Allen PJ, Josephs O, Turner R (2000): A method for removing imaging artifact from continuous EEG recorded during functional MRI. Neuroimage 12: 230–239. [DOI] [PubMed] [Google Scholar]
- Allen PJ, Polizzi G, Krakow K, Fish DR, Lemieux L (1998): Identification of EEG events in the MR scanner: the problem of pulse artifact and a method for its subtraction. Neuroimage 8: 229–239. [DOI] [PubMed] [Google Scholar]
- Benar CG, Aghakhani Y, Wang Y, Izenberg A, Al‐Asmi A, Dubeau F, Gotman J (2003): Quality of EEG in simultaneous EEG‐fMRI for epilepsy. Clin Neurophysiol 114: 569–580. [DOI] [PubMed] [Google Scholar]
- Bonmassar G, Hadjikhani N, Ives JR, Hinton D, Belliveau JW (2001a): Influence of EEG electrodes on the BOLD fMRI signal. Hum Brain Mapp 14: 108–115. [DOI] [PMC free article] [PubMed] [Google Scholar]
- Bonmassar G, Purdon PL, Jaaskelainen IP, Chiappa K, Solo V, Brown EN, Belliveau JW (2002): Motion and ballistocardiogram artifact removal for interleaved recording of EEG and EPs during MRI. Neuroimage 16: 1127–1141. [DOI] [PubMed] [Google Scholar]
- Bonmassar G, Schwartz DP, Liu AK, Kwong KK, Dale AM, Belliveau JW (2001b): Spatiotemporal brain imaging of visual‐evoked activity using interleaved EEG and fMRI recordings. Neuroimage 13: 1035–1043. [DOI] [PubMed] [Google Scholar]
- Christmann C, Ruf M, Braus DF, Flor H (2002): Simultaneous electroencephalography and functional magnetic resonance imaging of primary and secondary somatosensory cortex in humans after electrical stimulation. Neurosci Lett 333: 69–73. [DOI] [PubMed] [Google Scholar]
- Deyo RA, Diehr P, Patrick DL (1991): Reproducibility and responsiveness of health status measures. Statistics and strategies for evaluation. Control Clin Trials 12(Suppl.): 142–158. [DOI] [PubMed] [Google Scholar]
- Diehl B, Salek‐Haddadi A, Fish DR, Lemieux L (2003): Mapping of spikes, slow waves, and motor tasks in a patient with malformation of cortical development using simultaneous EEG and fMRI. Magn Reson Imaging 21: 1167–1173. [DOI] [PubMed] [Google Scholar]
- Foucher JR, Otzenberger H, Gounot D (2003): The BOLD response and the gamma oscillations respond differently than evoked potentials: an interleaved EEG‐fMRI study. BMC Neurosci 4: 22. [DOI] [PMC free article] [PubMed] [Google Scholar]
- Goldman RI, Stern JM, Engel J, Cohen MS (2000): Acquiring simultaneous EEG and functional MRI. Clin Neurophysiol 111: 1974–1980. [DOI] [PubMed] [Google Scholar]
- Hennig J, Speck O, Koch MA, Weiller C (2003): Functional magnetic resonance imaging: a review of methodological aspects and clinical applications. J Magn Reson Imaging 18: 1–15. [DOI] [PubMed] [Google Scholar]
- Hoffmann A, Jager L, Werhahn KJ, Jaschke M, Noachtar S, Reiser M (2000): Electroencephalography during functional echo‐planar imaging: detection of epileptic spikes using post‐processing methods. Magn Reson Med 44: 791–798. [DOI] [PubMed] [Google Scholar]
- Kessler RM (2003): Imaging methods for evaluating brain function in man. Neurobiol Aging 24(Suppl.): 21–35. [DOI] [PubMed] [Google Scholar]
- Krakow K, Allen PJ, Symms MR, Lemieux L, Josephs O, Fish DR (2000): EEG recording during fMRI experiments: image quality. Hum Brain Mapp 10: 10–15. [DOI] [PMC free article] [PubMed] [Google Scholar]
- Krakow K, Messina D, Lemieux L, Duncan JS, Fish DR (2001): Functional MRI activation of individual interictal epileptiform spikes. Neuroimage 13: 502–505. [DOI] [PubMed] [Google Scholar]
- Krakow K, Woermann FG, Symms MR, Allen PJ, Lemieux L, Barker GJ, Duncan JS, Fish DR (1999): EEG‐triggered functional MRI of interictal epileptiform activity in patients with partial seizures. Brain 122: 1679–1688. [DOI] [PubMed] [Google Scholar]
- Kruggel F, Herrmann CS, Wiggins CJ, von Cramon DY (2001): Hemodynamic and electroencephalographic responses to illusory figures: recording of the evoked potentials during functional MRI. Neuroimage 14: 1327–1336. [DOI] [PubMed] [Google Scholar]
- Kruggel F, Wiggins CJ, Herrmann CS, von Cramon DY (2000): Recording of the event‐related potentials during functional MRI at 3.0 Tesla field strength. Magn Reson Med 44: 277–282. [DOI] [PubMed] [Google Scholar]
- Laufs H, Kleinschmidt A, Beyerle A, Eger E, Salek‐Haddadi A, Preibisch C, Krakow K (2003): EEG‐correlated fMRI of human alpha activity. Neuroimage 19: 1463–1476. [DOI] [PubMed] [Google Scholar]
- Lemieux L, Krakow K, Fish DR (2001): Comparison of spike‐triggered functional MRI BOLD activation and EEG dipole model localization. Neuroimage 14: 1097–1104. [DOI] [PubMed] [Google Scholar]
- Liebenthal E, Ellingson ML, Spanaki MV, Prieto TE, Ropella KM, Binder JR (2003): Simultaneous ERP and fMRI of the auditory cortex in a passive oddball paradigm. Neuroimage 19: 1395–1404. [DOI] [PubMed] [Google Scholar]
- Lovblad KO, Thomas R, Jakob PM, Scammell T, Bassetti C, Griswold M, Ives J, Matheson J, Edelman RR, Warach S (1999): Silent functional magnetic resonance imaging demonstrates focal activation in rapid eye movement sleep. Neurology 53: 2193–2195. [DOI] [PubMed] [Google Scholar]
- Moosmann M, Ritter P, Krastel I, Brink A, Thees S, Blankenburg F, Taskin B, Obrig H, Villringer A (2003): Correlates of alpha rhythm in functional magnetic resonance imaging and near infrared spectroscopy. Neuroimage 20: 145–158. [DOI] [PubMed] [Google Scholar]
- Salek‐Haddadi A, Friston KJ, Lemieux L, Fish DR (2003a): Studying spontaneous EEG activity with fMRI. Brain Res Brain Res Rev 43: 110–133. [DOI] [PubMed] [Google Scholar]
- Salek‐Haddadi A, Lemieux L, Merschhemke M, Diehl B, Allen PJ, Fish DR (2003b): EEG quality during simultaneous functional MRI of interictal epileptiform discharges. Magn Reson Imaging 21: 1159–1166. [DOI] [PubMed] [Google Scholar]
- Schomer DL, Bonmassar G, Lazeyras F, Seeck M, Blum A, Anami K, Schwartz D, Belliveau JW, Ives J (2000): EEG‐linked functional magnetic resonance imaging in epilepsy and cognitive neurophysiology. J Clin Neurophysiol 17: 43–58. [DOI] [PubMed] [Google Scholar]
- Seeck M, Michel CM, Spinelli L, Lazeyras F (2001): EEG mapping and functional MRI in presurgical epilepsy evaluation. Rev Neurol (Paris) 157: 747–751. [PubMed] [Google Scholar]
- Thees S, Blankenburg F, Taskin B, Curio G, Villringer A (2003): Dipole source localization and fMRI of simultaneously recorded data applied to somatosensory categorization. Neuroimage 18: 707–719. [DOI] [PubMed] [Google Scholar]
- Wagner M, Fuchs M (2001): A framework for the integration of functional MRI, structural MRI, EEG and MEG. Int J Biomagnetism 3: 1. [Google Scholar]
- Zimine I, Seghier ML, Seeck M, Lazeyras F (2003): Brain activation using triggered event‐related fMRI. Neuroimage 18: 410–415. [DOI] [PubMed] [Google Scholar]


