
Figure 2.
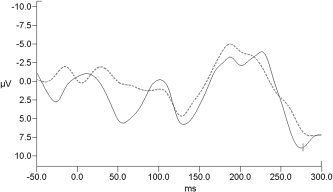
VEPs computation for one representative subject (electrode O1) from recording in static magnetic field (no fMRI scanning condition). The solid line represents the VEPs obtained without cardiac pulse artifact postprocessing correction; the dotted line represents the same signal obtained after cardiac pulse artifact removal. P1 and N1 peaks can be recognized in both cases, but uncorrected signal shows a higher noise.