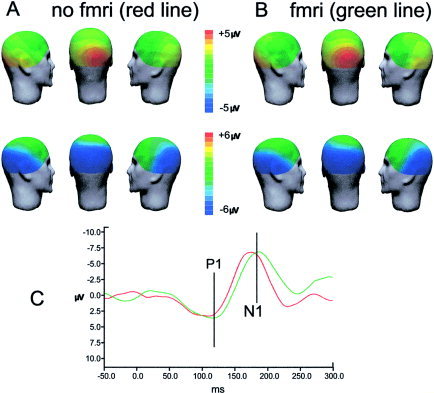
Figure 5.

Topographic maps of VEPs amplitude obtained after artifact‐removing procedures for the grand averages of all subjects. A: VEPs obtained in the recordings without fMRI scanning (after removal of cardiac pulse artifact only). B: VEPs obtained in the recordings during fMRI scanning (after removal of both fMRI scanning and cardiac pulse artifacts). C: VEPs waveforms at electrode O2 (red line, no fMRI condition; green line, fMRI condition). The occipital P1 and N1 peaks may be identified at similar latencies in both recording conditions.
