
Figure 6.
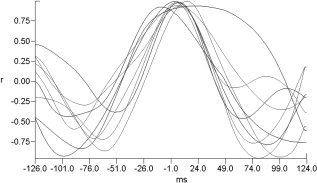
Cross‐correlation functions. For each subject, the selected occipital electrode is shown. In correspondence to 0‐ms time shift, a high value of correlation function was found, thus indicating a good similarity between the two VEPs waveforms.