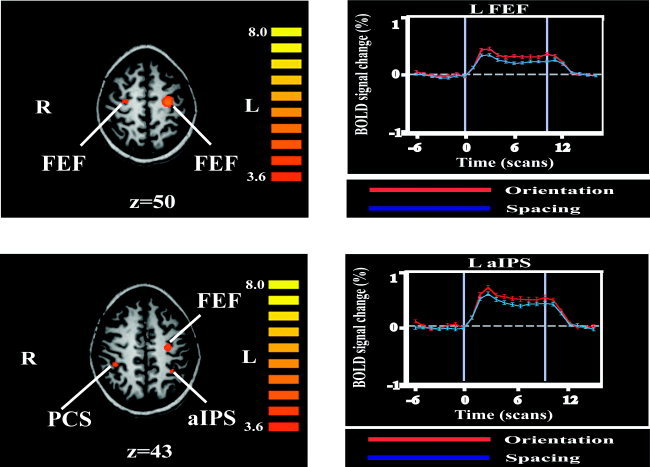
Figure 3.

Left: Activations for orientation compared to spacing task (see text for details and abbreviations), displayed on axial MR slices taken from one subject. Display threshold: t > 3.6; Talairach z‐value below each image; color t‐scale at right of each image. Ventral premotor cortex (PMv) and parietooccipital (POC) activations are not shown. Right: Time course of BOLD % signal change (mean ± SEM) at representative activation peaks. Each scan in a time series lasted for 3 s. Abbreviations as in text.
