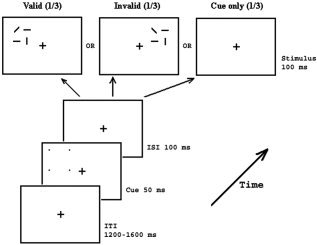
Figure 1.

Schematic illustration of the procedure of the present study. Each cue consisted of four small dots in the corner of a virtual square and was presented for 50 ms prior to the stimuli. Each stimulus consisted of two horizontal, one vertical, and one diagonal line and was presented for 100 ms. Cue‐to‐stimulus SOA was fixed at 150 ms. The cue predicted the location of the stimulus in 50% of trials. Participants' task was to respond to the orientation of the only diagonal line in the stimulus display (“/” vs. “\”). 20% of trials are cue‐only trials without presentation of the stimulus array.
