
Figure 2.
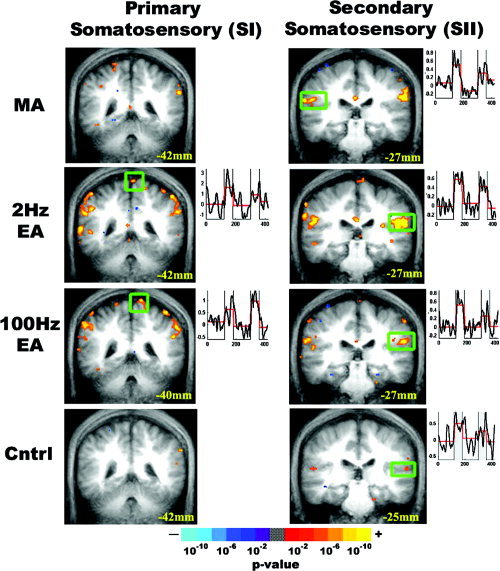
Somatosensory cortex response to experimental stimulation. Statistical parametric maps for group analysis of MA, EA, and sensory control are displayed over the group averaged anatomic MRI brain scan. Coronal slices are presented with their Talairach space location. Clusters with statistically significant response were smoothed, and color‐coded based on P value (see color bar). Time courses from the boxed region are displayed to the right of each image, demonstrating hemodynamic response. All stimulations produced activation of the contralateral and ipsilateral secondary somatosensory cortex (SII), whereas only high‐ and low‐frequency EA produced activation of the leg homuncular region in the contralateral primary somatosensory cortex (SI).