
Figure 2.
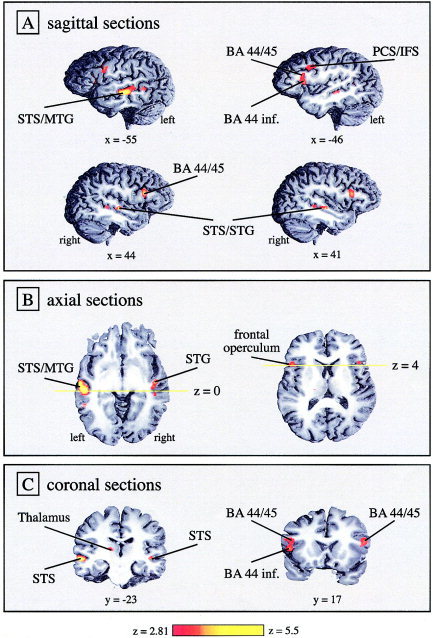
SPM{Z} for group statistics representing activity that was greater for long object wh‐questions than for short object wh‐questions. The statistical map was thresholded at Z > 2.81 (P < 0.0025 uncorrected) for visual display and rendered onto a high‐resolution structural MR scan of a representative individual brain. 3‐D renderings are presented in sagittal (A), axial (B), and coronal sections (C).