
Figure 3.
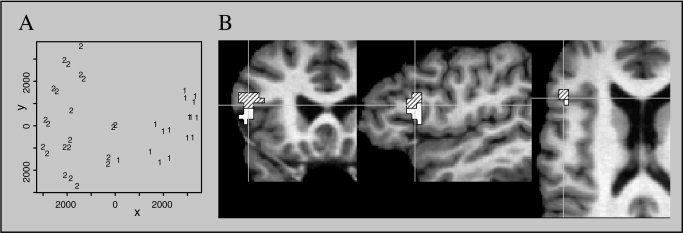
A: Multidimensional scaling map displaying clusters of more inferior (1) and more superior (2) voxels activated in the left inferior frontal gyrus. Relative distances as determined by the MDS method are represented by the x‐ and y‐axes. Absolute distances indicated by the values on the axes are arbitrary and therefore cannot be interpreted in any way. B: Coronal, sagittal, and axial slices representing the results of the multidimensional scaling analysis. The border between the superior and inferior portion of BA 44 is clearly visible.