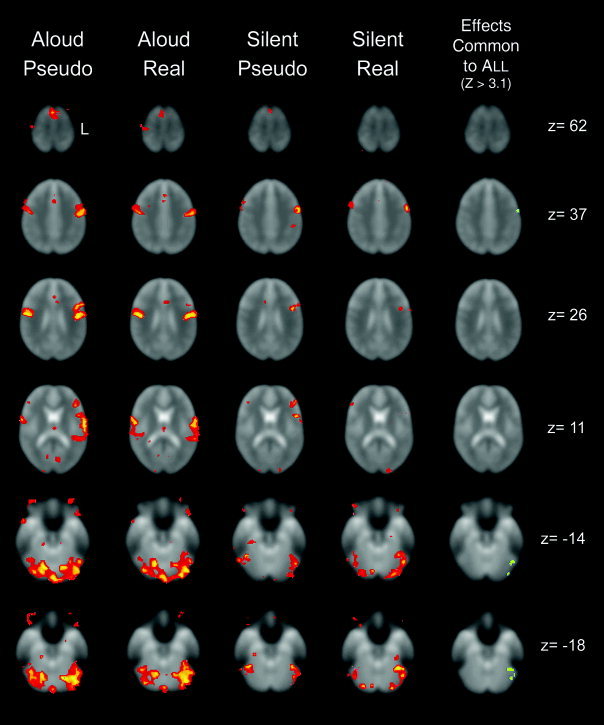
Figure 2.

Transverse sections illustrating areas of significant activity for the four task conditions relative to the fixation baseline. From left to right: aloud pseudoword reading; aloud real word reading; silent pseudoword reading; silent real word reading; and the conjunction of all four tasks showing regions of activity common to all tasks. For all figures the z‐coordinate given is in the coordinate space of the atlas of Talairach and Tournoux [1988]. Images are portrayed in the radiological convention, with the left side of the brain (L) represented on the right side of the figure and anterior is towards to top of the figure. For visualization purposes, activity is displayed at a critical threshold of Z > 2.33 (P < 0.01, uncorrected).
