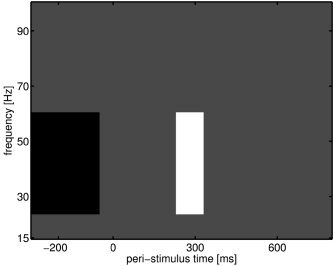
Figure 7.

Contrast component for taking difference between two power averages, within trial. The gray values are zero, the black values are negative, and the white values are positive. The actual values are based on the total number of power values in each average.
