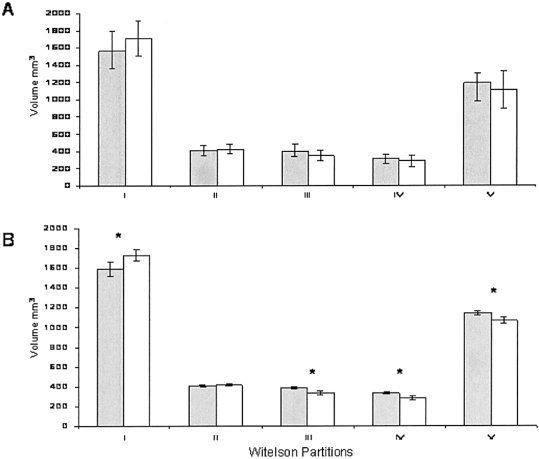
Figure 3.

Average volume for WP regions after rTSN corrected for global volume: A: Classic WP measurements. B: WP measurements after TSN processing. *Statistically significant difference between groups (P < 0.05). Gray bars, controls; white bars, 18q.
