
Figure 5.
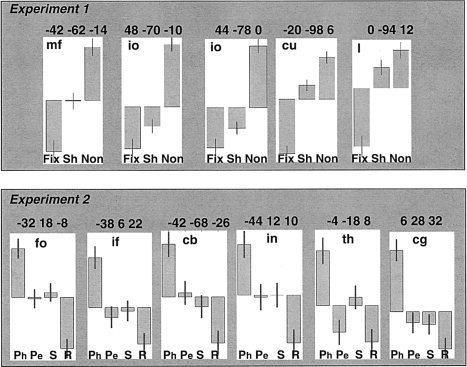
The relative effect sizes for Experiment 1 and 2 in areas more activated by object naming when the baseline was low than high. Mean centered plots showing relative effect sizes for Fix (fixation), Sh (2‐D geometric shapes); and Non (3‐D non‐objects) in Experiment 1; and Ph (phonological task); Pe (perceptual task); S (semantic task), and R (resting with eyes closed) in Experiment 2. Each plot is labeled with the peak co‐ordinates of the effects reported in Table II; af, anterior fusiform; mo, middle occipital; tp, temporal pole; ph, parahippocampal; cs, calcarine sulcus; dc, dorsal cuneus; ift, inferior frontal (triangularis); cb, cerebellum; it, inferior temporal.