
Figure 7.
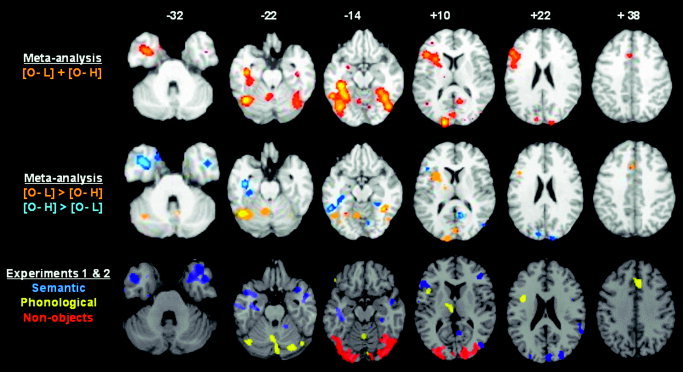
Comparison of the effects observed in the meta‐analyses, Experiments 1 and 2. The top row shows the main effect of all studies entered into the meta‐analyses on axial slices of the brain −32 mm, −22 mm, −14 mm, +10 mm, +22 mm, and +38 mm relative to the AC–PC line. The second row shows the difference in the meta‐analyses for object naming with low (orange) and high (blue) baselines (on the same slices as the top line). O, object naming; L, low‐level baseline; H, high‐level baseline. The third row shows activation in red for non‐objects relative to shapes and fixation (Experiment 1), in yellow for the phonological task (Experiment 2), and in blue for the semantic task (Experiment 2). Differences in the shape of the brain reflect the different templates used in Experiments 1 and 2 (MNI template from SPM99); and in the meta‐analysis. Likewise, differences in the color scale reflect the different analysis packages. The threshold for activation was P < 0.05 in the meta‐analyses and P < 0.001 for non‐objects and the phonological task. For semantic activation, the threshold was set at P < 0.001 in slices 10 and 22 but P < 0.05 in slices −32, −22 and −14 (to highlight the effects in the temporal poles and anterior fusiform). As can be seen, there is a high correspondence between the orange areas in the second row and the red and yellow areas in the third row, and in the blue areas in the second and third rows. Details of listing all activations can be found in Table II.