
Figure 2.
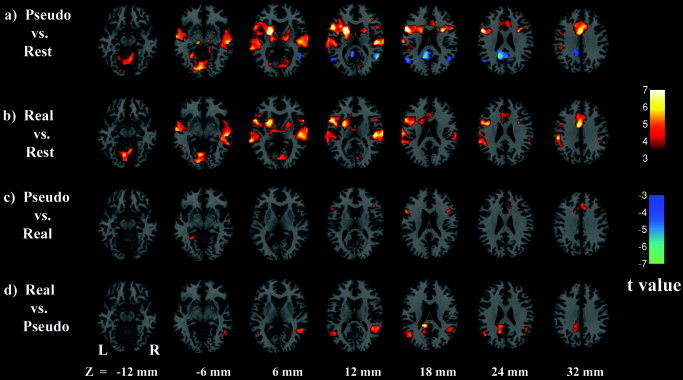
Axial t‐maps of brain activation (P < 0.005, minimum 20 contiguous voxels) for pseudoword vs. rest (a), real word vs. rest (b), pseudoword vs. real word (c), and real word vs. pseudoword (d). Deactivation in c and d are not shown to avoid redundancy. The images were superimposed on a standard SPM anatomic template brain in neurologic convention with z‐coordinate for each slice shown in Talairach space.