
Figure 3.
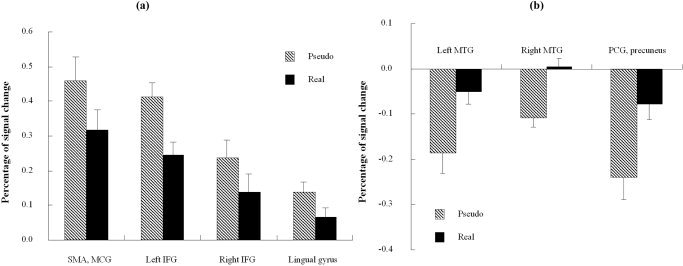
Mean percentage BOLD signal change of activated regions in the pseudoword vs. real word contrast, separated by stimulus condition. a: Regions more activated for pseudowords than for real words. b: Regions more activated (positively) for real words than for pseudowords. See Table I for abbreviations. The signal differences between the two conditions were significant for all regions shown (P = 0.001 level; two‐tail paired t‐tests.