
Figure 2.
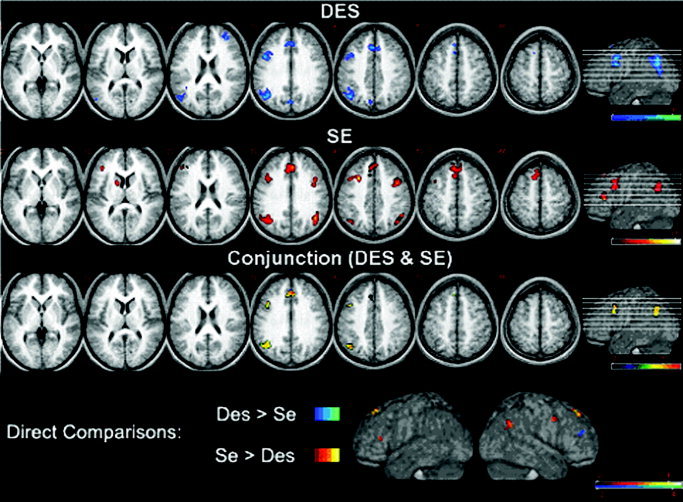
From top to bottom, activation foci for the DES and the SE tasks (P < 0.001, uncorrected for multiple comparisons; t > 4.14), for the conjunction analysis (P < 0.01, corrected for multiple comparisons; t > 4.02), and for the direct comparisons between the two tasks (red, SE > DES; blue, DES > SE; P < 0.005, uncorrected for multiple comparisons; t > 3.17). Areas of increased activation were superimposed on seven representative axial slices of the group mean anatomic image, derived from the T1‐weighted images of the participants. The number above each slice represents its distance (in mm) from the AC–PC plane. The height of the individual slices is also shown, in the rightmost part of the figure, on a rendering of the same average brain.