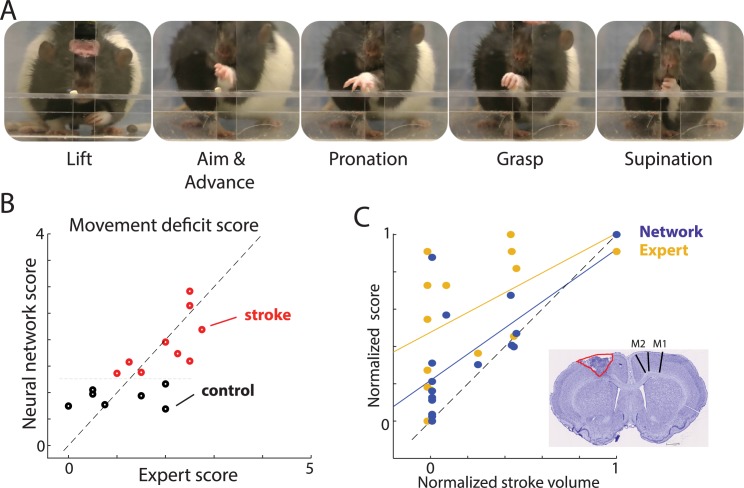
Fig 2. Automated scoring of movement deficits in the SPRT.
(A) Video frames showing selected movement elements in the task. (B) Scatterplot of corresponding network and expert scores. Each circle denotes averaged score for a single rat. Note that stroke (red) versus control (black) could be separated along the network score (y-axis) but not along x-axis corresponding to the expert scores. (C) Scatterplot of stroke volume and corresponding scores by the network (blue) and human expert (yellow). The distribution of blue points closer to the identity line (dashed) indicates that network scores are more strongly correlated with stroke lesion volume than were the expert scores. Inset shows a representative histological image from a rat with a lesion (infarct area outlined; extent of M1 and M2 is denoted by lines in the intact hemisphere). Lesion volume and movement scores were normalized between 0 and 1 in order to directly compare both scores. Each dot represents the average score for one rat, and solid lines show linear regressions (blue: network score; yellow: expert score). The distribution of blue dots closer to the identity line (dashed) shows that the network scores better predict lesion volume in this dataset. The sample network and data on which this figure is based are available at github.com/hardeepsryait/behaviour_net. M1, primary motor area; M2, secondary motor area; SPRT, single-pellet reaching task.

