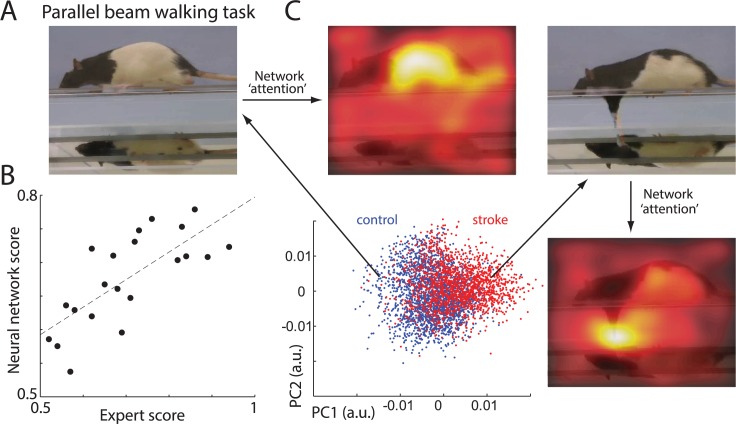
Fig 10. Network validation on different behavioral tasks.
(A) Sample frame showing a rat on the parallel-beam-walking task. Note the mirror below the rat is showing an additional view of paw placement. (B) Relationship between expert and network scoring. Each dot represents the average score for a single rat. (C) Representation of video frames transformed into the internal feature space of the network. Each point represents a single video fame. Blue points represent video frames from control rats and red points from stroke rats. For picture clarity, only 20% of randomly selected points are shown. Long arrows point to sample video frames from control and stroke groups. Short arrows point to “attention” maps superimposed on frames: parts of frames most informative for network decision (marked in lighter colors). It indicates that similar to experts, the network uses foot slips to score stroke deficits (micro symptoms), but it also discovered that body posture and/or speed (macro symptoms) improves scoring. The sample network on which this figure is based is available at github.com/hardeepsryait/behaviour_net. a.u., arbitrary units; PC, principal component.

