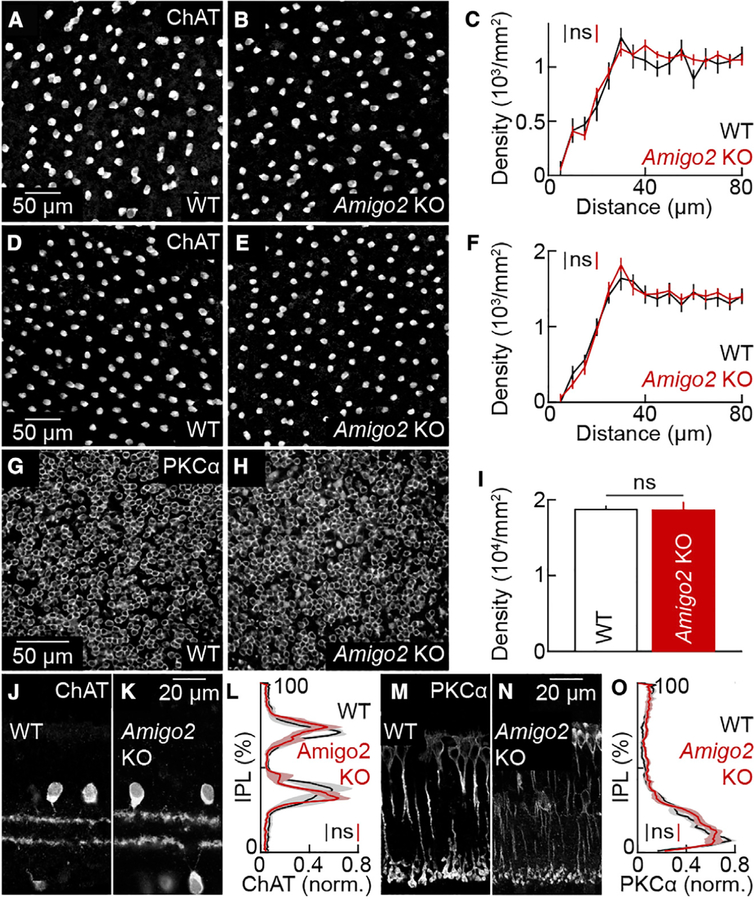
Figure 2. Soma and Neurite Distributions of SACs and RBCs in Wild-Type and Amigo2 KO Mice.
(A and B) Images of the ganglion cell layer in retinal flat mounts from wild-type (A) and Amigo2 KO (B) retinas stained for ChAT.
(C) Density recovery profiles (mean ± SEM) of SACs in the ganglion cell layer of wild-type (n = 7 retinas) and Amigo2 KO (n = 12 retinas) mice; p = 0.74 by bootstrapping. The overall density of SACs in the ganglion cell layer was not significantly different between wild-type (1,143 ± 70 cells mm−2) and Amigo2 KO retinas (1,108 ± 38 cells mm−2; p = 0.89 by Mann-Whitney U test.
(D and E) Images of the inner nuclear layer in retinal flat mounts from wild-type (D) and Amigo2 KO (E) retinas stained for ChAT.
(F) Density recovery profiles (mean ± SEM) of SAC cell bodies in the inner nuclear layer of wild-type (n = 8 retinas) and Amigo2 KO (n = 11 retinas) mice; p = 0.98 by bootstrapping. The overall density of SACs in the nuclear layer was not significantly different between wild-type (1,472 ± 108 cells mm−2) and Amigo2 KO retinas (1,453 ± 79 cells mm−2; p = 0.97 by Mann-Whitney U test.
(G and H) Images of the inner nuclear layer in retinal flat mounts from wild-type (G) and Amigo2 KO (H) retinas stained for PKCɑ.
(I) Density (mean ± SEM) of RBCs in wild-type (18,738 ± 435 cells mm−2, n = 4 retinas) and Amigo2 KO (18,629 ± 1,036 cells mm−2, n = 5 retinas) mice; p = 0.91 by Mann-Whitney U test.
(J and K) Sections of P20 wild-type (J) and Amigo2 KO (K) retinas stained for ChAT.
(L) Lines (shaded areas) indicate the mean (± SEM) ChAT lamination patterns in the inner plexiform layer (IPL) in wild-type (n = 4 retinas) and Amigo2 KO (n = 8 retinas) mice; p = 0.43 by bootstrapping.
(M and N) Sections of P20 wild-type (M) and Amigo2 KO (N) retinas stained for PKCɑ.
(O) Lines (shaded areas) indicate the mean (± SEM) PKCɑ lamination patterns in the IPL in wild-type (n = 8 retinas) and Amigo2 KO (n = 9 retinas) mice; p = 0.40 by bootstrapping.
Throughout the figure, ns indicates no significant differences for statistical comparisons.
See also Figure S2.

