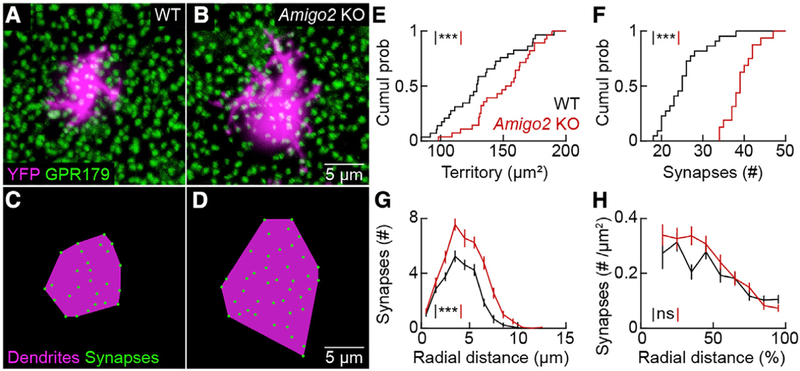
Figure 7. RBC Dendrites Expand and Form More Synapses in Amigo2 KO Mice.
(A and B) Maximum intensity projections of confocal image stacks of the outer plexiform layer of wild-type (A) and Amigo2 KO (B) retinas. RBC dendrites are labeled by AAV-Grm6-YFP and postsynaptic specializations are marked by GPR179 clusters.
(C and D) Schematic representation of dendrite territories (magenta) and synapses (green) of the RBCs in (A) (shown in C) and (B) (shown in D), respectively.
(E) Cumulative distributions of RBC dendrite territories in wild-type (131.4 ± 5.2 μm2,n= 29 cells, n =5 retinas) and Amigo2 KO (149.9 ± 4.5 μm2, n = 28 cells, n = 4 retinas) mice; p = 0.0075 by Mann-Whitney U test.
(F) Cumulative distributions of RBC dendritic synapses in wild-type (25.2 ± 1.1, n = 22 cells, n = 5 retinas) and Amigo2 KO (39.13 ± 0.89, n = 16 cells, n = 4 retinas) mice; p = 6.1 3 10−7 by Mann-Whitney U test.
(G) Summary data (mean ± SEM) of the distribution of synapses onto RBCs as a function of the absolute distance from the center of their dendritic territory in wild-type (n = 22 cells, n = 5 retinas) and Amigo2 KO (n = 16 cells, n = 4 retinas) mice; p = 1.0 3 10−5 by bootstrapping.
(H) Summary data (mean ± SEM) of the synapse density across RBC dendrite territories as a function of the relative distance from the center of the territory in wild-type (n = 22 cells, n = 5 retinas) and Amigo2 KO (n = 16 cells, n = 4 retinas) mice; p = 0.16 by bootstrapping.
Throughout the figure, ***p < 0.001 and ns indicates no significant differences for statistical comparisons.
See also Figures S4 and S5.

