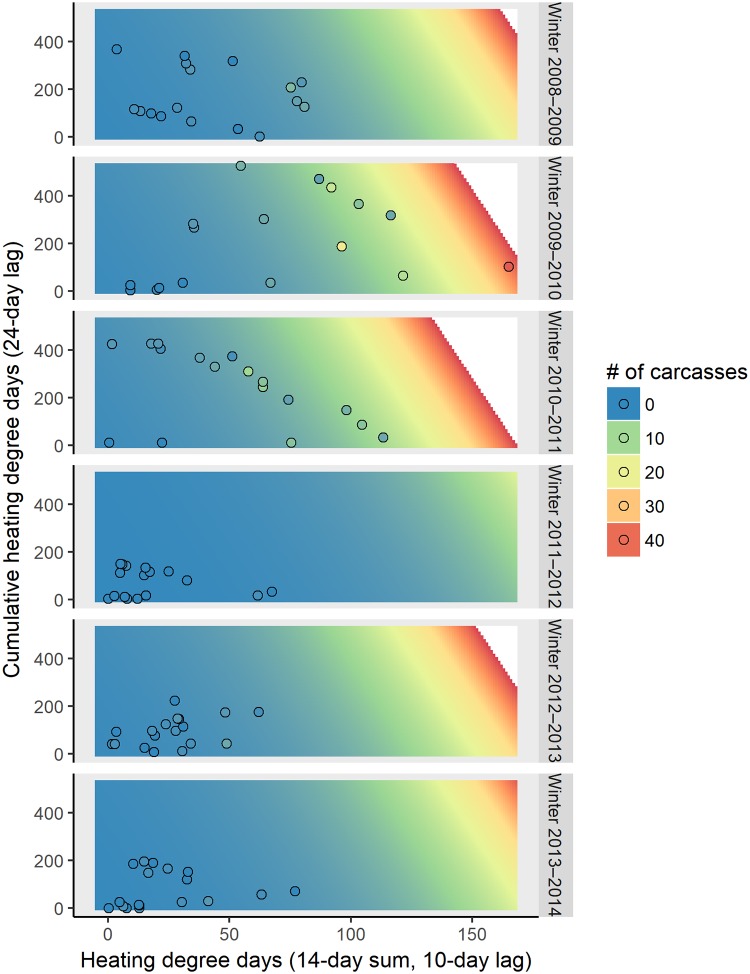
Fig 4. The predicted 7-day counts of cold-related manatee carcasses reported in the central-east region using air temperature based on the winter (each panel), short-term (14-day sum, lagged by 10 days; x-axis) and cumulative temperature effects (lagged by 24 days; y-axis) from the top-ranked model.
Each panel represents the observed (circles) and predicted (colored area) number of cold-related carcasses reported over 7 days for each winter. The background color represents the predicted number of cold-related carcasses reported over 7 days, and the color of the circles represent the observed number of cold-related carcasses reported over 7 days. The scale for the number of carcasses is continuous (from blue to red), but for the ease of visualization, the legend displays the colors at intervals of 10 carcasses. We did not make predictions for the number of expected carcasses above the highest number reported during a 7-day period (area in white).

