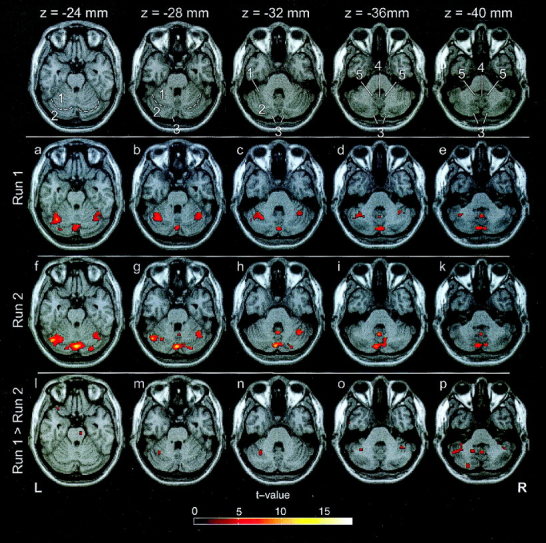
Figure 1.

Areas of cerebellar activation due to saccadic stimulation in run 1 (second row) and run 2 (third row), projected onto a standard template brain (P < 0.001, n = 11). The lower row depicts regions showing significantly higher BOLD signal in run 1 than in run 2 (P < 0.01, n = 11). The first row defines anatomical locations that have been verified with the help of coronal and sagittal sections: simple lobule (1), separated from superior semilunar lobule (2) by the posterior superior fissure (dashed line), inferior semilunar lobule (3), uvula (4), and the tonsils (5) [Duvernoy, 1995]. Activations can be found in the superior semilunar lobule (a,f), inferior semilunar lobule (d,e,i,k), and simple lobule (a–d,f–h), as well as in the vermal structures uvula (d,e,g–k), extending into the tonsils (e,k), folium/declive, tuber and pyramid of vermis (a–k), extending into the inferior semilunar lobule. In the subtraction (run 1–run 2; bottom) a significant decrease of BOLD signal was found in the superior semilunar lobule (o,p), inferior semilunar lobule (p), and simple lobule (m,n), as well as in the uvula, the tonsil (p), and the pons (l).
