
Figure 10.
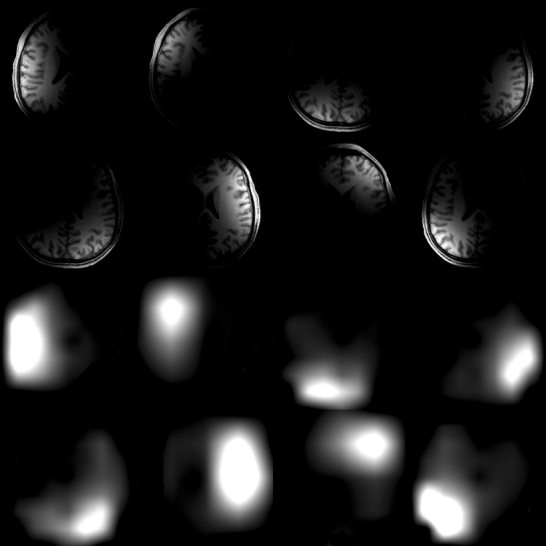
The full‐FOV reference images from an 8‐channel array coil (top) and their optimal sensitivity profile estimates (bottom) using DWT and MVP. The sensitivity profiles correlate well to the individual coil locations.
Official websites use .gov
A
.gov website belongs to an official
government organization in the United States.
Secure .gov websites use HTTPS
A lock (
) or https:// means you've safely
connected to the .gov website. Share sensitive
information only on official, secure websites.
The full‐FOV reference images from an 8‐channel array coil (top) and their optimal sensitivity profile estimates (bottom) using DWT and MVP. The sensitivity profiles correlate well to the individual coil locations.