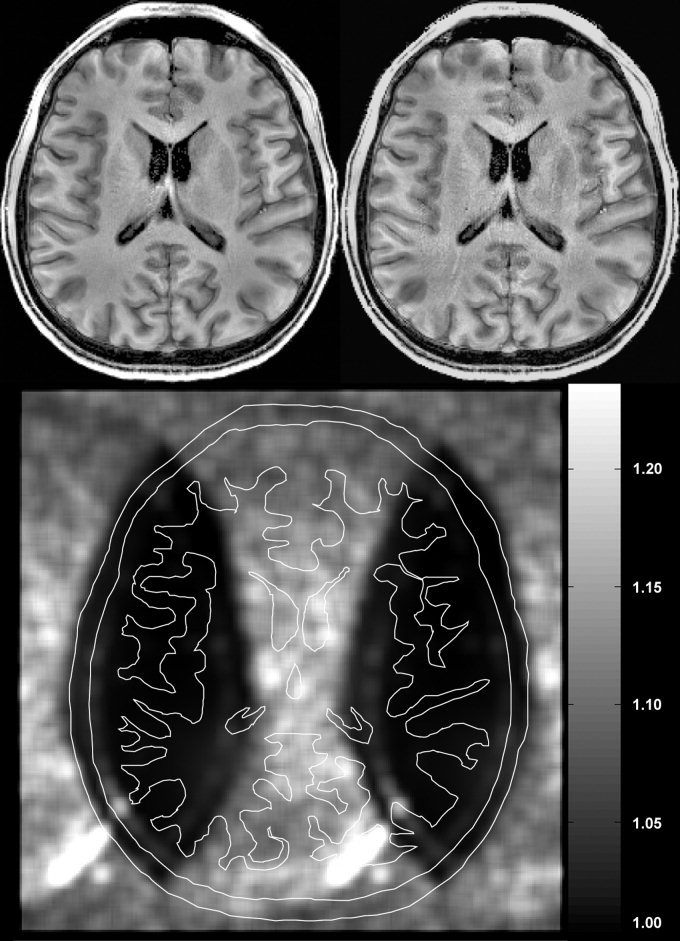
Figure 11.

Inhomogeneity corrected full‐FOV image from an 8‐channel array coil (left) and SENSE acquisition with acceleration of 2.0 (right). Standard SENSE reconstruction was used to unfold the aliased images using information from all 8 channels in the array. The degraded SNR in the SENSE acquisition is mainly due to subsampling of k‐space data by half. Additionally, noise is added during the SENSE reconstruction. The magnitude and spatial distribution of this noise is shown in the G‐factor map (bottom). An outline of the brain anatomy is overlaid on the G factor map to show the location of the brain.
