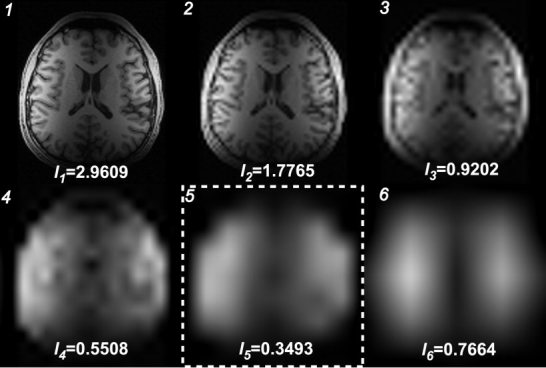
Figure 4.

Estimated sensitivity profiles and inhomogeneity indices for each of the 6 levels (1) of wavelet decomposition and reconstruction. Level 5 (boxed by white dashed line) was found to provide the optimal estimation based on the inhomogeneity index Il.
