
Figure 9.
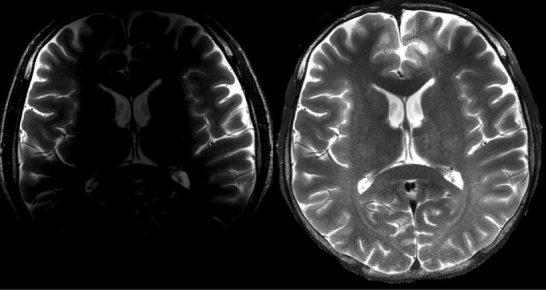
Application of the DWT estimation of coil sensitivity profile and MVP to a T2‐weighted image for inhomogeneity correction. The 2‐channel array coil was placed at the bi‐temporal lobe. The uncorrected image appears on the left. The corrected image (right) shows more details at the deep brain compared to the original one.