
Figure 1.
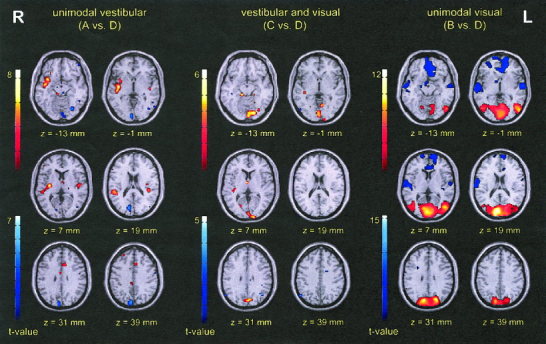
Activation maps showing activations (red) and deactivations (blue) during purely vestibular (A), simultaneous (B), and purely visual (C) stimulation vs. rest condition (D) (n = 13; P < 0.001), superimposed onto the MNI standard brain template.