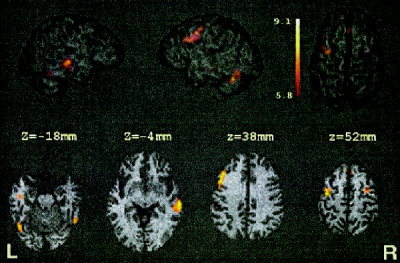
Figure 4.

Cohort z‐maps showing significant activations for blocks containing mixed comparisons contrasted against the P and W blocks. Activations are rendered onto a 3D view of the brain. Axial slices are provided for many of the local maxima (Table III). The left side of the axial slices corresponds to the left side of the brain. Other symbols are as in Figure 2.
