
Figure 7.
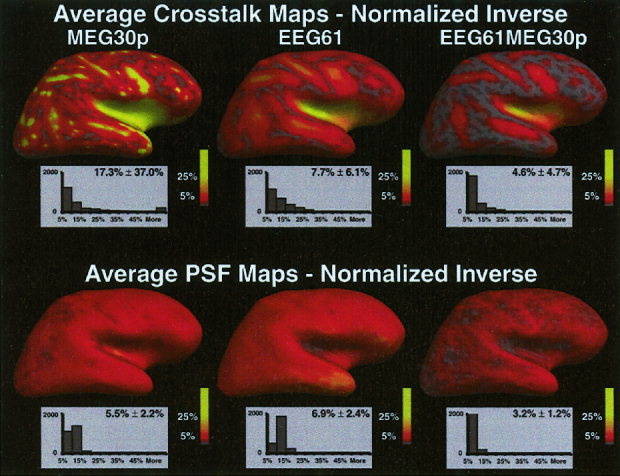
Average crosstalk and average PSF maps for the noise sensitivity normalized inverse operator. The average crosstalk or point spread for each location is encoded in color. Full red equals 5% and full yellow equals 25% crosstalk or point spread. Below each map is the histogram of the number of dipoles with average crosstalk/point spread values within a 5% bin. No fMRI weighting was used.