
Figure 4.
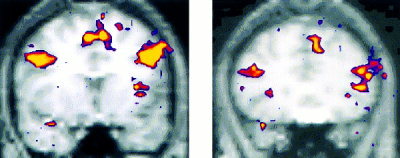
Activation map for group averaged data for the Novel vs. Repeated contrast showing significant activation in two locations within prefrontal cortex (shown on left) Brodmann areas 9/44, (Talairach coordinates for peak activated voxel x,y,z −43, 9, 31) and (shown on right) Brodmann areas 45/46 (28, 21, 6).