
Figure 4.
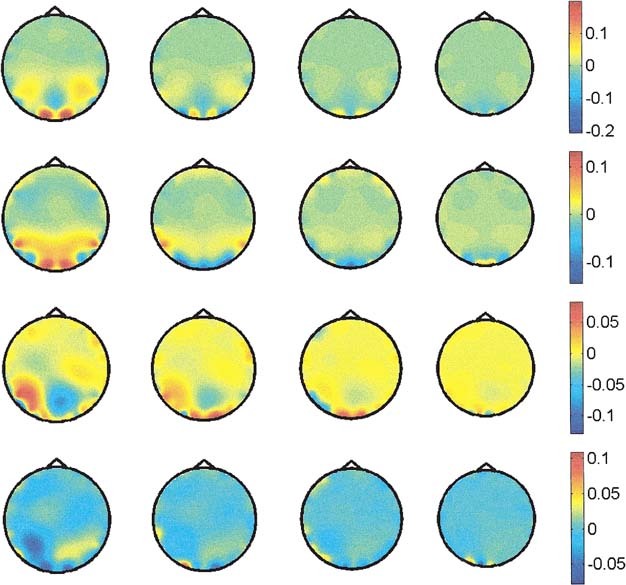
Potential distribution in depth obtained using ELECTRA for central (CVF) and right (RVF) visual field stimulation. First row shows the early response for CVF at 72 msec after stimuli onset, and second row at 92 msec. Third and fourth rows show the early response (75 msec) and middle latency response (109 msec) for RVF. Only the four lowest slices are shown because no significant activity is observed in the upper ones.