
Figure 4.
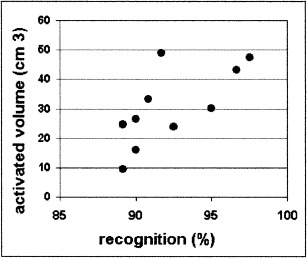
Mean activation volume of selected areas plotted against mean recognition score per subject for all three studies. The two measures have significant correlation of 0.728 (P = .01), meaning that better recognition of pictures afterward is accompanied by more brain activation during encoding of those pictures.