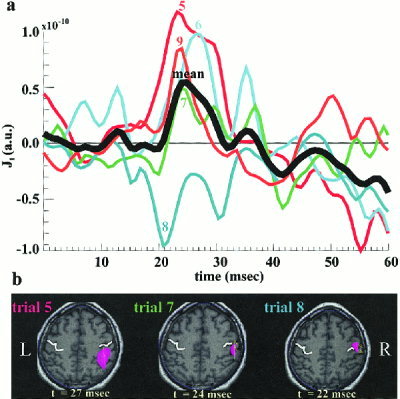
Figure 2.

The MFT solutions for 5 STs (Trials 5–9) from strong left median nerve stimulation. (a) The response time courses from right SI ROI, together with their average (heavy black line). (b) Instantaneous distribution of activity in an axial slice through the SI ROI at the latency with strongest activity between 20 and 30 msec. The heavy white line marks the central sulcus. The color‐shaded areas indicate regions with activity above 70% of the instantaneous maximum (IM) in activity over the slice, while the arrows indicate the current flow directions. For Trial 5 the first IM is identified at 24 msec, in the fundus of the sulcus (not shown) and a second IM with a higher value is encountered later, at 27 msec, at the PPA (left figurine). For Trials 6,7,9 the IM in activity remains for a long period just behind the central sulcus; the middle figurine shows the overall maximum at 24 msec for Trial 7. For Trial 8 the strongest activation is at 22 msec, in front of the central sulcus with current density direction along the motor strip (right figurine).
