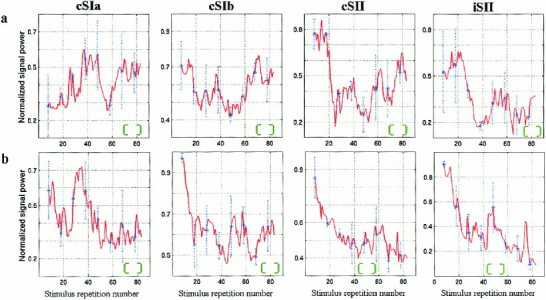
Figure 4.

Changes in SP content as a function of trial number for each event are derived from robust moving averaging (RMA). (a) Las‐stimulation. (b) Ras‐stimulation. The grand‐average across the three subjects was computed after the individual sequences of SP‐estimates were scaled so that the maximum was unity. In the same graph, the corresponding standard deviation is marked as a blue vertical dash line to indicate the extent of inter‐subject variability. The green envelope serves as an indicator of the RMA window‐width. The figure shows resurgence of activity (best seen in SI) and rapid habituation (best seen in Ras cSIb and all SII cases).
