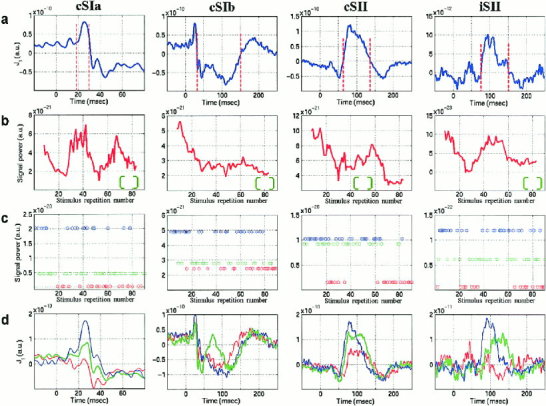
Figure 5.

Unfolding the response dynamics from the averaged signal in Ras for subject N3. (a) Definition of event range based on the average signal. (b) Evolution of event‐SP along the trial‐to‐trial dimension. (c) Group membership of STs after unsupervised classification into three groups; the clusters produced by the fuzzy c‐means algorithm were sorted according to the within‐group SP‐measurements and their members are denoted with asterisks at the corresponding SP‐level. (d) The cluster centroids, plotted in the same color as the cluster members in (c), provide a decomposition of the average event into three wavelets (sub‐averages).
