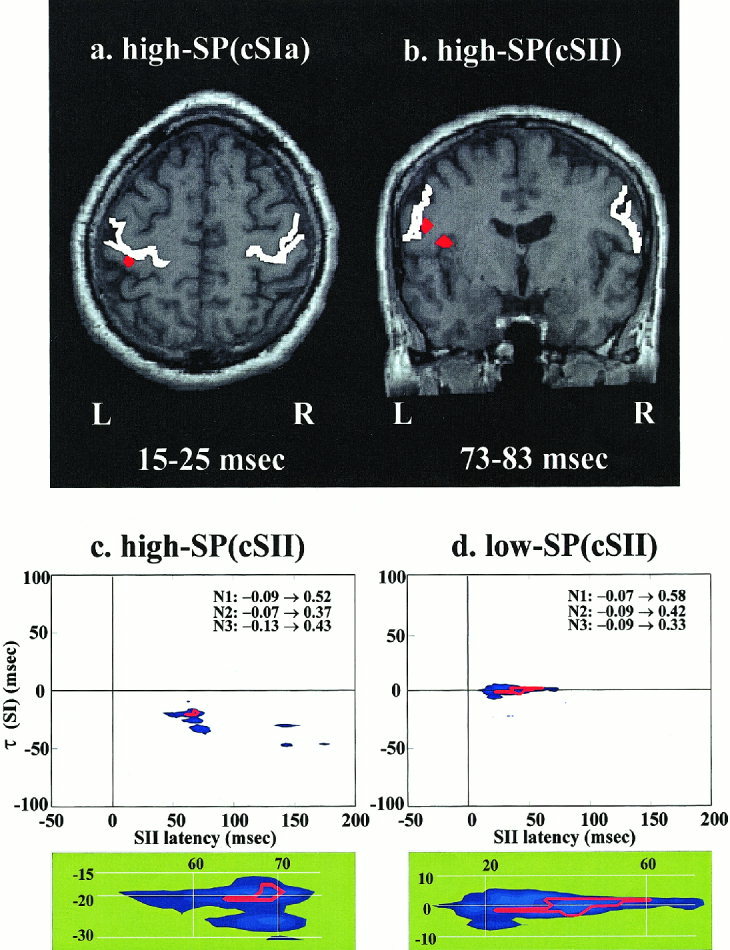
Figure 7.

Across subjects consistency of activity distribution (upper panel) and connectivity between areas (lower panel) within selected ST‐subsets in Ras. (a) High‐SP(cSIa) subset: the only region with common significant increase in activity (P < 0.05 corrected) across the three subjects is just behind the contralateral (left) central sulcus at the level of the Omega knob [Yousry et al., 1997]. This activity is seen in two successive post‐stimulus windows covering the latency range 15–31 msec. (b) High‐SP(cSII) subset: two nearby areas are identified, the contralateral SII and the adjacent superior part of insula cortex in the window 73–83 msec. Only the insula activation survives in the next overlapping window (79–89 msec). (c) High‐SP(cSII) subset: the blue shade shows areas where the grand‐average of the MI across the three subjects is high. The individual MI‐maps are re‐scaled so that the maximum is 1 and a red‐contour bounds the area in the (t, τ) plane for which all re‐normalized MI‐maps are above 0.5. The well‐defined overlapping region is enlarged and shown in the green shaded panel below. (d) Low‐SP(cSII) subset: the same as (c). In (c) and (d) the range of MI values in the (t, τ) plane for each subject (N1, N2, and N3) are printed in text.
