
Figure 6.
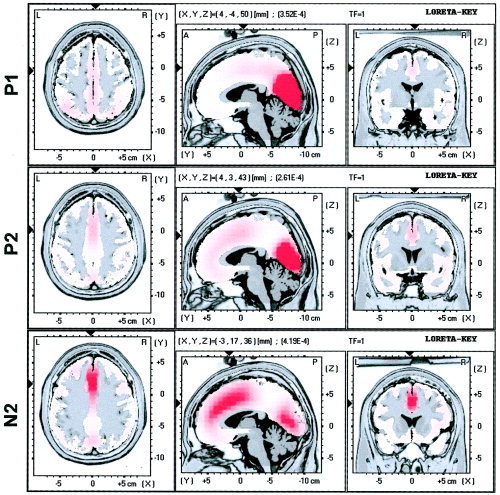
Images of neural activity from a single average of the responses to all stimuli, computed with LORETA for P1, P2, and N2 factor scores. The main focuses are represented through three orthogonal brain views in Talairach space, sliced through the region of the maximum activity. Left slice: axial, seen from above, nose up; center slice: sagittal, seen from the left; right slice: coronal, seen from the rear. Talairach coordinates: x from left (L) to right (R); y from posterior (P) to anterior (A); z from inferior to superior. Black triangles at the margins of each view point the location of the main frontal focus. [Color figure can be viewed in the online issue, which is available at www.interscience. wiley.com.]