
Figure 1.
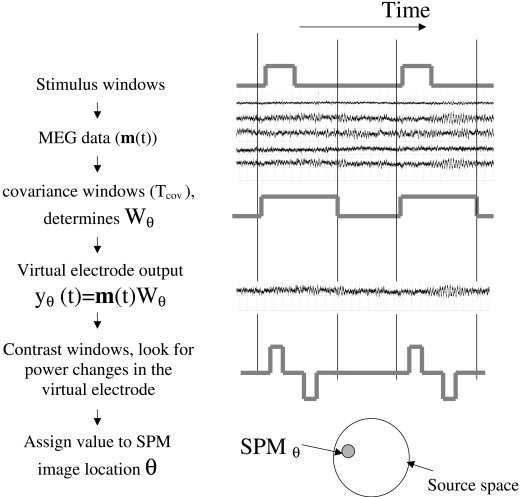
Schematic showing the partitioning of MEG data and the processing steps involved in making the SPM. The MEG data (m(t)) can be divided into epochs, each epoch containing a stimulus or task‐related time period defined by a stimulus window. A data segment of interest, or covariance window (Tcov), is used to calculate the MEG data covariance that in turn will determine the properties of the spatial filter (W θ). At each source location θ, the spatial filter gives rise to an estimate of the electrical activity (or virtual electrode output y θ(t)). A SPM value at θ is produced by statistical comparisons made on the virtual electrode output between the time‐frequency ranges specified by the contrast windows (in this case Tactive and Tpassive).