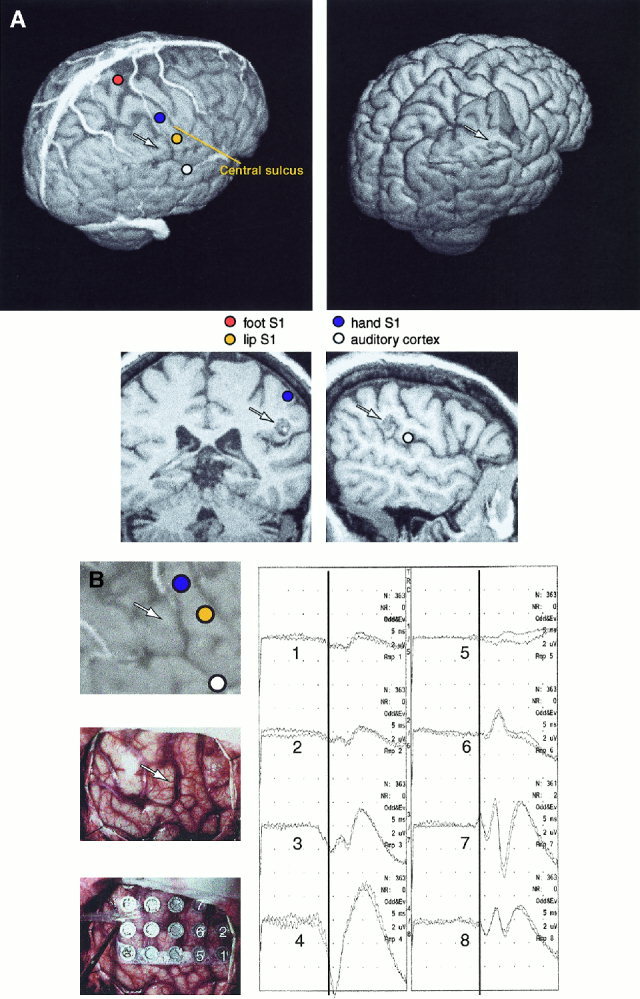
Figure 2.

A: Left, above: 3‐D surface rendering of the brain of Patient 10, including cortical veins and sources of SEFs and AEFs. Right, above: Section of the 3‐D surface rendering is removed to reveal the subcortical cavernous hemangioma, and the sulcal route used for its removal. Below: A coronal MRI section showing the source of median nerve SEF, and a sagittal section showing the source of AEF 100‐ms response. The tumor is below the median nerve source and posterior to the AEF source; in combination with the sulcal pattern this finding pinpoints the tumor projection to the cortical surface, readily identified during the exposure of the cortex. The arrows show the approximate location of the subcortical tumor. B: Left, above: Enlarged section of the 3‐D surface rendering of Patient 10. Intraoperative photograph without (middle) and with the SEP recording grid (below). Right: Intracortical SEPs from 8 electrodes. The electrode numbers are indicated on the grid; polarity reversal of SEP at 23 ms occurs between electrodes 3 and 7 (electrodes 3, 4, and 8 are under the dura). The arrows show the approximate location of the subcortical tumor.
